Microsoft Power BI transforms raw data into interactive visualizations with affordable pricing options from free to enterprise-level solutions.
Introduction to Microsoft Power BI
What is Microsoft Power BI and its Purpose?
Microsoft Power BI is a business analytics service that delivers insights to enable fast, informed decisions. As part of the Microsoft Power Platform, Power BI is designed to help businesses analyze data and share insights. It transforms raw data into interactive, visually immersive dashboards and reports that provide actionable insights and drive business results.
The purpose of Power BI is simple yet profound: to make data accessible and understandable to everyone in an organization, regardless of their technical background. It bridges the gap between data and decision-making by providing user-friendly tools for data visualization and analysis.
🔍 Key Purpose: Turn complex data into clear visual insights that drive smarter business decisions.
Who is Microsoft Power BI Designed For?
Power BI caters to a diverse range of users across various organizational roles:
- Business Analysts who need to process large datasets and create comprehensive reports
- Data Scientists looking to visualize and share their findings
- Executives and Decision Makers requiring quick access to KPIs and business metrics
- IT Professionals who manage data infrastructure and security
- Small Business Owners seeking affordable data analytics solutions
- Marketing Teams analyzing campaign performance and customer behavior
- Sales Teams tracking leads, opportunities, and revenue forecasts
- Finance Departments monitoring budgets and financial performance
The tool’s scalability makes it suitable for organizations of all sizes, from small startups to large enterprises with complex data environments.
Getting Started with Microsoft Power BI: How to Use It
Getting started with Power BI involves a few straightforward steps:
- Download and Install: Begin by downloading Power BI Desktop from the Microsoft website or use Power BI Service (web-based version)
- Connect to Data Sources: Connect to your databases, Excel spreadsheets, cloud services, or hundreds of other supported data sources
- Transform and Model Data: Clean and prepare your data using the built-in Power Query Editor
- Create Visualizations: Drag and drop fields to create charts, graphs, maps, and tables
- Build Dashboards: Combine related visualizations into interactive dashboards
- Share and Collaborate: Publish your reports to Power BI Service to share with colleagues
For beginners, Microsoft offers extensive documentation, tutorials, and a supportive community through the Power BI Community forum. The interface is designed to be intuitive, allowing users to start creating basic reports within hours of first use.
👉 Pro Tip: Start with Power BI Desktop (free) to learn the basics before exploring Power BI Service for organizational deployment.
Microsoft Power BI’s Key Features and Benefits
Core Functionalities of Microsoft Power BI
Power BI’s comprehensive feature set makes it a versatile tool for data analysis and visualization:
| Feature Category | Key Capabilities |
|---|---|
| Data Connectivity | Connect to 100+ data sources including SQL, Excel, SharePoint, and third-party services |
| Data Transformation | Clean, reshape, and combine different data sources with Power Query |
| Data Modeling | Create relationships between tables, define calculations with DAX formulas |
| Visualization | 30+ built-in visuals plus custom visuals from AppSource marketplace |
| AI Capabilities | AI-powered features for data insights, anomaly detection, and decomposition trees |
| Embedded Analytics | Embed reports and dashboards into applications and websites |
| Mobile Access | Native mobile apps for iOS, Android, and Windows devices |
| Security | Row-level security, encryption, and compliance with major standards |
The platform is continuously evolving, with monthly updates introducing new features and improvements based on user feedback and industry trends.
Advantages of Using Microsoft Power BI
Power BI offers numerous benefits that have contributed to its widespread adoption:
- Ease of Use: Intuitive drag-and-drop interface accessible to users with various technical backgrounds
- Seamless Microsoft Integration: Works perfectly with other Microsoft products like Excel, Teams, and Dynamics 365
- Cost-Effective: Affordable entry point with free desktop version and reasonable subscription pricing
- Regular Updates: Monthly releases with new features and improvements
- Powerful Data Modeling: Robust capabilities for complex data relationships
- Customizability: Extensive options for tailoring visualizations and reports
- Speed of Implementation: Quick to deploy and start generating insights
- Strong Security: Enterprise-grade security features and compliance certifications
- Scalability: Grows from individual use to enterprise-wide deployment
These advantages make Power BI an attractive option for organizations seeking to democratize data analysis across teams.
Main Use Cases and Applications
Power BI shines in numerous real-world scenarios:
- Financial Analysis and Reporting: Track budget performance, forecast revenue, and analyze financial trends
- Sales and Marketing Intelligence: Monitor campaign effectiveness, analyze customer behavior, and identify sales opportunities
- Operational Dashboards: Real-time monitoring of key operational metrics and KPIs
- Supply Chain Visualization: Track inventory levels, optimize logistics, and monitor supplier performance
- HR Analytics: Analyze workforce metrics, track recruiting effectiveness, and monitor employee satisfaction
- Customer Analytics: Understand customer segments, behavior patterns, and satisfaction metrics
- Healthcare Analytics: Monitor patient outcomes, optimize resource allocation, and improve care quality
- Educational Insights: Track student performance, resource utilization, and institutional metrics
For example, a retail company might use Power BI to create a dashboard that combines sales data, inventory levels, and customer demographics to identify which products perform best in different regions and with different customer segments.
Exploring Microsoft Power BI’s Platform and Interface
User Interface and User Experience
Power BI’s interface is designed to balance power with accessibility:
Power BI Desktop Interface:
- Left Navigation Pane: Access to Report, Data, and Model views
- Middle Canvas: Main workspace for creating and editing visuals
- Right Fields Pane: Lists available data fields and formatting options
- Top Ribbon: Contains tools for visualizations, modeling, and view options
Power BI Service (Web) Interface:
- Navigation Menu: Access to workspaces, apps, and shared content
- Home Screen: Shows recent reports, dashboards, and favorites
- Workspace View: Organizes content into logical groups for collaboration
The interface follows Microsoft’s Fluent Design System, providing a consistent experience for users familiar with other Microsoft products. The learning curve is generally moderate—users comfortable with Excel can typically get up to speed quickly, while more advanced features require additional learning.
💡 UX Highlight: The “Ask a Question” natural language query feature allows users to type questions about their data in plain English and get instant visualizations.
Platform Accessibility
Power BI is designed with accessibility in mind:
- Cross-Platform Availability: Works on Windows (Desktop), web browsers (Service), and mobile devices (iOS, Android)
- Keyboard Navigation: Full keyboard support for users who can’t use a mouse
- Screen Reader Compatibility: Works with screen readers like JAWS and NVDA
- High Contrast Themes: Support for Windows high contrast settings
- Alt Text for Visuals: Add alternative text to visuals for screen readers
- Focus Modes: Ability to focus on specific visuals for easier consumption
- Mobile Optimization: Responsive design that adapts to different screen sizes
Microsoft provides comprehensive accessibility documentation and regularly improves accessibility features to ensure the platform is usable by people with diverse abilities.
Microsoft Power BI Pricing and Plans
Subscription Options
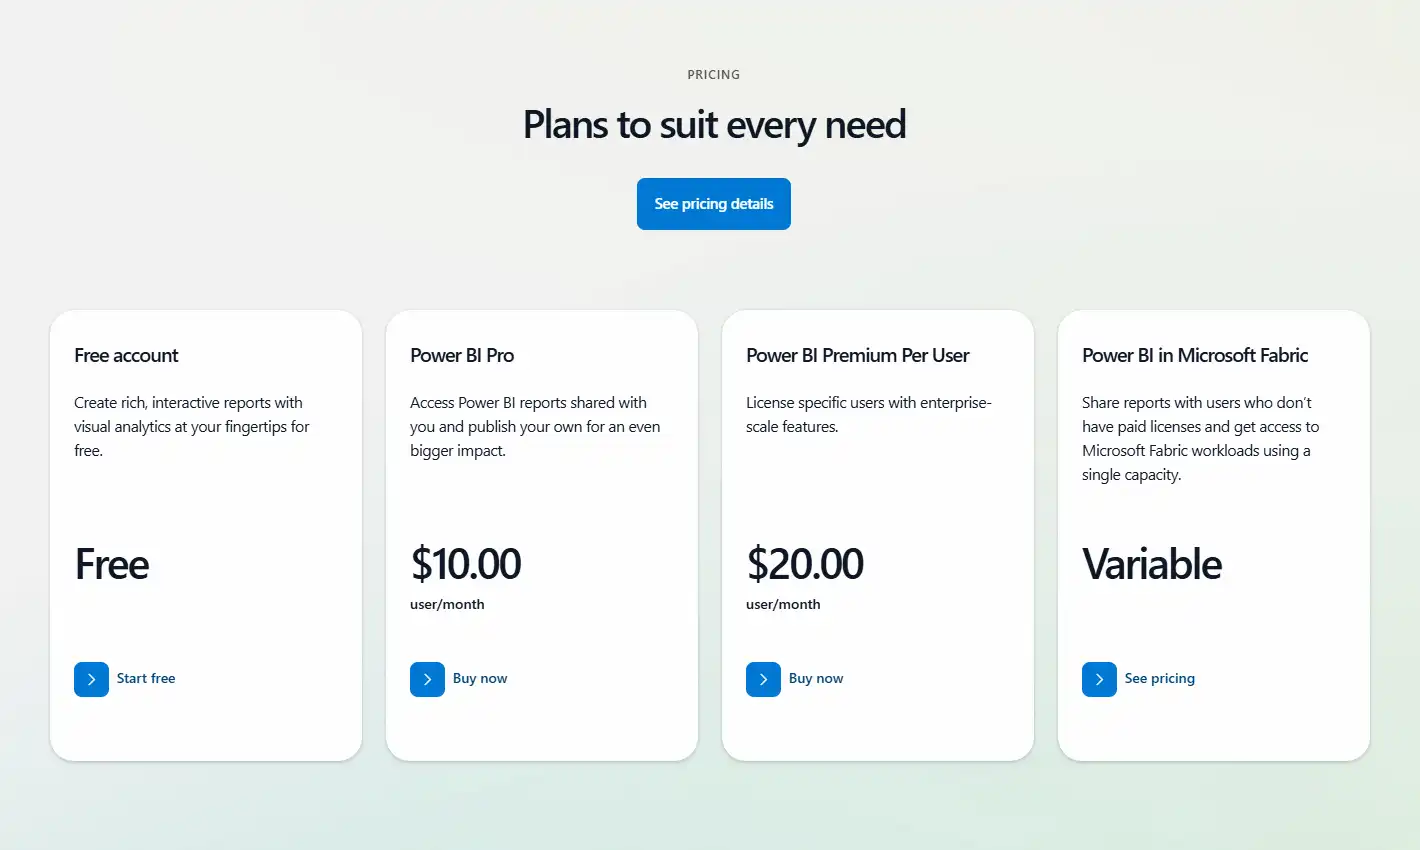
Power BI offers several pricing tiers to accommodate different user needs and organizational requirements:
| Plan | Price | Target User |
|---|---|---|
| Power BI Desktop | Free | Individual analysts creating reports |
| Power BI Pro | $10/user/month | Business users needing collaboration features |
| Power BI Premium Per User | $20/user/month | Users needing advanced features |
| Power BI Premium Per Capacity | Starting at $4,995/month | Organizations with enterprise-scale needs |
| Power BI Embedded | Pay-as-you-go | Developers embedding analytics in applications |
Organizations with Microsoft 365 E5 licenses already include Power BI Pro as part of their subscription, adding additional value.
Free vs. Paid Features
Understanding the differences between free and paid versions helps organizations choose the right investment level:
Power BI Desktop (Free) includes:
- Creating reports and visualizations
- Connecting to 70+ data sources
- Data transformation and modeling
- Local saving and publishing to web
- Basic data refreshes
Power BI Pro ($10/user/month) adds:
- Sharing reports and dashboards
- Creating app workspaces for collaboration
- Analyzing data in Excel
- Email subscriptions and alerts
- Embedding reports in internal web portals
- 8 data refreshes daily
Power BI Premium Per User ($20/user/month) or Capacity adds:
- Higher refresh rates (48/day)
- Larger model sizes (100 GB vs 1 GB)
- AI capabilities
- Paginated reports
- On-premises report publishing
- Advanced security and governance
- Dedicated computing resources
Most organizations start with Desktop for individual analysts and add Pro licenses for teams that need to collaborate on and share reports.
Microsoft Power BI Reviews and User Feedback
Pros and Cons of Microsoft Power BI
Based on aggregated user feedback from multiple review platforms, here’s a balanced view of Power BI’s strengths and limitations:
Pros:
- Intuitive interface that’s accessible to non-technical users
- Excellent data visualization capabilities with numerous chart types
- Strong integration with Microsoft ecosystem
- Regular updates with new features
- Robust mobile experience
- Great value for money compared to competitors
- Strong community and learning resources
- Powerful data modeling capabilities
Cons:
- Performance can slow with very large datasets (without Premium)
- DAX formula language has a steep learning curve
- Some advanced features require Premium subscription
- Version control and change management could be improved
- Report sharing limited in free version
- Can be resource-intensive on older hardware
- Some users report occasional stability issues
User Testimonials and Opinions
Real users share their experiences with Power BI:
“Power BI transformed how our marketing team analyzes campaign performance. What used to take days of Excel work now happens in minutes, and the interactive dashboards make it easy for everyone to understand the data.” — Marketing Director at a mid-size retail company
“The learning curve for advanced features is steep, but the investment is worth it. Once you master DAX formulas and proper data modeling, there’s almost nothing you can’t analyze.” — BI Analyst at a financial services firm
“We evaluated several BI tools, and Power BI offered the best balance of capabilities and cost. The free Desktop version let us prove the concept before investing in Pro licenses for the team.” — IT Manager at a healthcare provider
According to G2, Power BI maintains a 4.5/5 star rating based on over 1,500 reviews, with particularly high scores for ease of use and quality of support.
Microsoft Power BI Company and Background Information
About the Company Behind Microsoft Power BI
Microsoft Power BI is developed and maintained by Microsoft Corporation, one of the world’s leading technology companies. Power BI was first released to the public in July 2015, though its origins date back to earlier Microsoft Excel add-ins and SQL Server Reporting Services.
The development of Power BI reflects Microsoft’s strategic shift toward cloud-based services and data intelligence under CEO Satya Nadella’s leadership. It’s positioned as a key component of Microsoft’s broader Power Platform, which also includes Power Apps, Power Automate, and Power Virtual Agents.
Key milestones in Power BI’s development include:
- 2013: Initial release as “Power BI for Office 365”
- 2015: Launch of redesigned Power BI as a standalone service
- 2017: Introduction of Power BI Premium
- 2019: AI capabilities added to the platform
- 2020: Introduction of Premium Per User licensing
- 2021: Enhanced integration with Microsoft Teams
- 2022: Introduction of DirectQuery for Power BI datasets and dataflows
Microsoft’s continuous investment in Power BI has established it as a leader in Gartner’s Magic Quadrant for Analytics and Business Intelligence Platforms for 15 consecutive years.
Microsoft Power BI Alternatives and Competitors
Top Microsoft Power BI Alternatives in the Market
Several competing products offer alternatives to Power BI, each with distinct strengths:
- Tableau: Known for sophisticated visualizations and strong data exploration capabilities
- Qlik Sense: Features a unique associative engine for discovering hidden relationships
- Looker (Google): Provides a semantic modeling layer and LookML for consistent metrics
- Domo: Offers strong social collaboration features and pre-built connectors
- SAP BusinessObjects: Enterprise-focused with strong integration to SAP systems
- IBM Cognos Analytics: Includes AI-assisted data preparation and exploration
- Sisense: Specializes in handling large, complex datasets with in-chip technology
- ThoughtSpot: Features natural language search and AI-driven analytics
Each alternative appeals to different user needs, from enterprise-scale deployments to specialized analytical capabilities.
Microsoft Power BI vs. Competitors: A Comparative Analysis
When comparing Power BI to its main competitors, several factors stand out:
| Factor | Power BI | Tableau | Qlik Sense | Looker |
|---|---|---|---|---|
| Starting Price | Free desktop, $9.99/user/mo | $70/user/mo | $30/user/mo | Custom pricing |
| Ease of Use | ⭐⭐⭐⭐ | ⭐⭐⭐⭐ | ⭐⭐⭐ | ⭐⭐⭐ |
| Data Visualization | ⭐⭐⭐⭐ | ⭐⭐⭐⭐⭐ | ⭐⭐⭐⭐ | ⭐⭐⭐ |
| Data Handling | ⭐⭐⭐⭐ | ⭐⭐⭐⭐ | ⭐⭐⭐⭐⭐ | ⭐⭐⭐⭐ |
| Microsoft Integration | ⭐⭐⭐⭐⭐ | ⭐⭐⭐ | ⭐⭐⭐ | ⭐⭐ |
| Mobile Experience | ⭐⭐⭐⭐ | ⭐⭐⭐⭐ | ⭐⭐⭐ | ⭐⭐⭐ |
| Enterprise Features | ⭐⭐⭐⭐ | ⭐⭐⭐⭐⭐ | ⭐⭐⭐⭐ | ⭐⭐⭐⭐ |
| Community Support | ⭐⭐⭐⭐⭐ | ⭐⭐⭐⭐⭐ | ⭐⭐⭐ | ⭐⭐⭐ |
Power BI’s primary advantages include its cost-effectiveness, Microsoft ecosystem integration, and regular feature updates. Tableau excels in visualization flexibility and data exploration, while Qlik Sense offers powerful data association capabilities. Looker provides robust governance and consistent metric definitions.
The best choice depends on specific organizational needs, existing technology investments, and user skill levels.
Microsoft Power BI Website Traffic and Analytics
Website Visit Over Time
Microsoft Power BI’s website (powerbi.microsoft.com) shows consistent growth in traffic, reflecting increasing interest in business intelligence tools. While exact numbers are proprietary, industry analytics indicate steady growth in visitor numbers over the past few years, with notable spikes during major feature releases and Microsoft events like Build and Ignite conferences.
Geographical Distribution of Users
Power BI has a global user base with particularly strong adoption in:
- United States (25%)
- India (12%)
- United Kingdom (8%)
- Germany (6%)
- Canada (5%)
- Australia (4%)
- France (3%)
- Brazil (3%)
- Japan (2%)
- Other countries (32%)
This distribution highlights Power BI’s global appeal and Microsoft’s success in penetrating both established and emerging markets.
Main Traffic Sources
Visitors find their way to the Power BI website through various channels:
- Organic Search: ~45% (primarily through searches for business intelligence tools and data visualization solutions)
- Direct Traffic: ~25% (users typing the URL directly or using bookmarks)
- Referrals: ~15% (from Microsoft.com, Office.com, and partner websites)
- Social Media: ~8% (primarily LinkedIn and Twitter)
- Paid Search/Display: ~7% (Microsoft’s advertising campaigns)
The high percentage of organic search traffic indicates strong brand recognition and interest in the Power BI platform specifically, rather than just general BI tool searches.
Frequently Asked Questions about Microsoft Power BI (FAQs)
General Questions about Microsoft Power BI
What is the difference between Power BI Desktop and Power BI Service?
Power BI Desktop is a free application installed on your local computer used for creating reports, while Power BI Service is the cloud-based platform used for sharing, viewing, and collaborating on reports and dashboards.
Does Power BI work on Mac?
Power BI Desktop is Windows-only, but Mac users can access Power BI Service through web browsers. Alternatively, Mac users can run Power BI Desktop using Windows virtualization software.
How often is Power BI updated?
Microsoft releases updates for Power BI Desktop monthly, typically in the first week of each month. Power BI Service is updated continuously.
Can Power BI connect to my existing databases?
Yes, Power BI connects to numerous data sources, including SQL Server, Oracle, MySQL, PostgreSQL, Excel files, CSV files, and many cloud services like Salesforce and Google Analytics.
Feature Specific Questions
What programming languages can I use with Power BI?
Power BI supports DAX (Data Analysis Expressions) for calculations, M language for data transformations in Power Query, and integration with R and Python for advanced analytics.
How does Power BI handle data refresh?
Free users can refresh data manually or schedule daily refreshes. Pro and Premium users can schedule up to 8 or 48 refreshes per day, respectively, and use gateways to connect to on-premises data sources.
Is there a limit to how much data Power BI can handle?
Power BI Desktop and Pro have a 1GB model size limit. Power BI Premium expands this to 100GB and includes larger dataset support with incremental refresh capabilities.
Can I embed Power BI reports in my own applications?
Yes, through Power BI Embedded service. This allows developers to integrate Power BI reports into custom applications using APIs and SDKs provided by Microsoft.
Pricing and Subscription FAQs
Is there a free version of Power BI?
Yes, Power BI Desktop is completely free for individual use. There’s also a free tier of Power BI Service with limited sharing capabilities.
What happens to my reports if I cancel my subscription?
If you downgrade from Pro to Free, shared content becomes inaccessible until you resubscribe. Reports created in Desktop remain accessible locally.
Can I try Power BI Pro before purchasing?
Yes, Microsoft offers a 60-day free trial of Power BI Pro, allowing users to test all features before committing to a subscription.
Do I need a Pro license for each user in my organization?
Generally, yes—anyone who needs to share or view shared content requires a Pro license. However, with Premium capacity, Pro licenses are only needed for content creators, not consumers.
Support and Help FAQs
Where can I learn how to use Power BI?
Microsoft offers extensive resources including official documentation, guided learning paths, YouTube tutorials, community forums, and the Power BI blog. Third-party training is also widely available.
How do I get technical support for Power BI?
Support options depend on your subscription level. Free users can access community forums, Pro users get standard support, and Premium customers receive priority support with faster response times.
Is there a certification for Power BI skills?
Yes, Microsoft offers the PL-300 certification (Power BI Data Analyst Associate) to validate Power BI expertise.
Can I request new features for Power BI?
Yes, through the Power BI Ideas forum where users can suggest and vote on feature requests. Microsoft regularly implements top-voted features.
Conclusion: Is Microsoft Power BI Worth It?
Summary of Microsoft Power BI’s Strengths and Weaknesses
After thoroughly examining Microsoft Power BI, here’s a balanced assessment of its merits and limitations:
Key Strengths:
- Exceptional value with a free desktop version and affordable Pro licensing
- Seamless integration with Microsoft’s ecosystem
- Intuitive interface accessible to business users
- Robust data modeling capabilities
- Regular feature updates and improvements
- Strong security and governance features
- Vibrant community and abundant learning resources
- Comprehensive mobile experience
Notable Weaknesses:
- Performance limitations with very large datasets in non-Premium versions
- Steeper learning curve for advanced features and DAX formulas
- Some governance features restricted to Premium tier
- Report layout can be challenging on different screen sizes
- Not as visualization-rich as specialized competitors like Tableau
Final Recommendation and Verdict
Microsoft Power BI earns a strong recommendation for most business intelligence needs. Its combination of accessibility, power, and affordability makes it suitable for organizations of all sizes.
For small businesses and individual analysts, the free Desktop version offers remarkable capabilities without any investment. Mid-sized organizations benefit from the collaboration features in Pro, while larger enterprises with complex data needs will find value in Premium’s advanced capabilities.
Power BI is particularly compelling for organizations already invested in the Microsoft ecosystem, where the integration with Excel, Teams, and other Microsoft services creates a seamless experience.
While competitors may offer advantages in specific use cases—Tableau for advanced visualizations or Qlik for associative analysis—Power BI offers the best overall balance of features, usability, and cost for most scenarios.
Microsoft Power BI delivers on its promise to democratize data analytics, making powerful business intelligence accessible to organizations of all sizes. With its combination of user-friendly interface, robust capabilities, and reasonable pricing, Power BI is an excellent choice for most business intelligence needs.