Explore how Looker’s business intelligence platform helps organizations transform complex data into consistent, accessible insights for better decisions.
Have you ever felt overwhelmed by the sheer volume of business data at your disposal, uncertain how to transform those numbers into actionable insights? If you’re nodding in agreement, you’re not alone. In today’s data-driven business landscape, having access to data isn’t enough – you need the right tools to interpret it effectively. That’s where Looker comes in, offering a powerful solution to turn raw data into meaningful business intelligence.
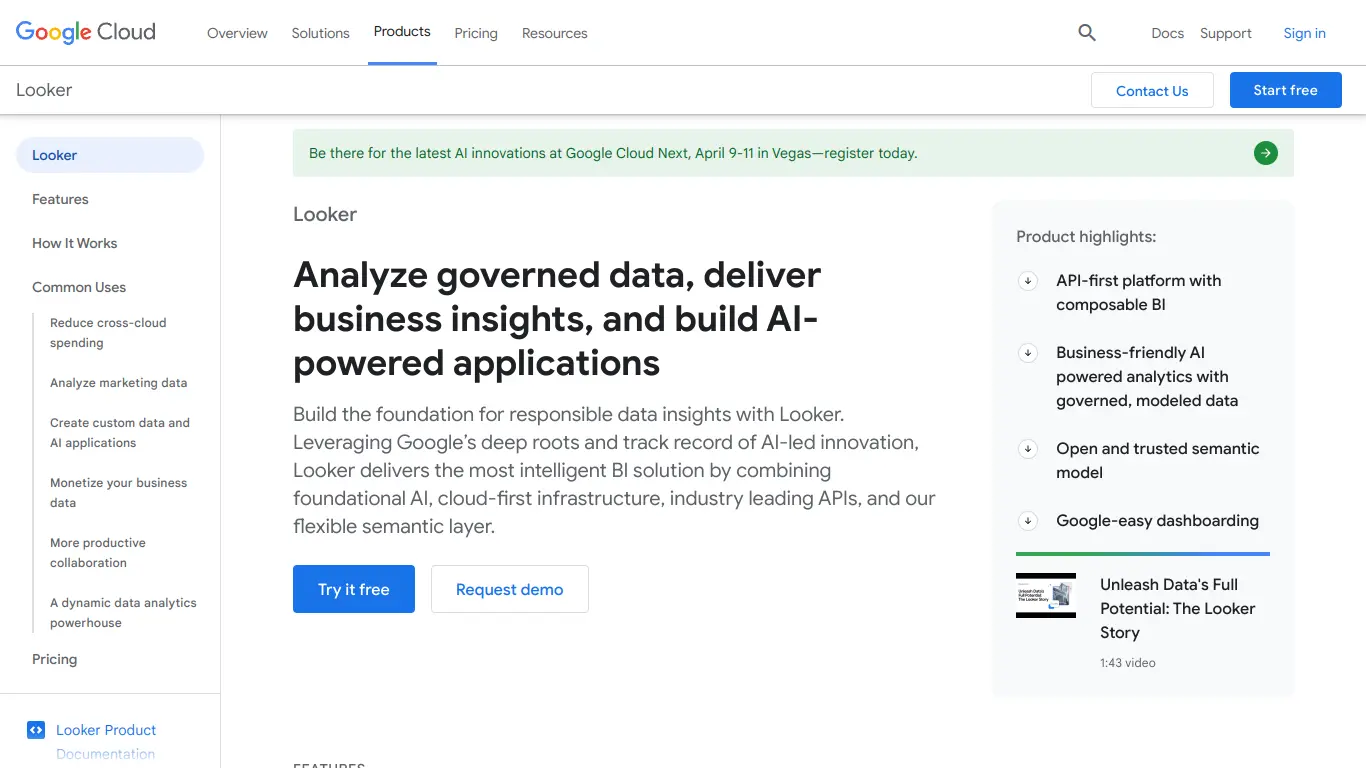
Introduction to Looker
What is Looker and its Purpose?
Looker is a sophisticated business intelligence (BI) and data analytics platform acquired by Google Cloud in 2019. At its core, Looker serves as a bridge between complex data and accessible insights, empowering organizations to make data-informed decisions without requiring advanced technical expertise from every user.
Unlike traditional BI tools that often function as standalone applications, Looker operates as a comprehensive data platform built around a unique modeling layer called LookML. This proprietary modeling language allows data teams to define relationships, calculations, and business rules once, creating a consistent “single source of truth” that all users can access.
The primary purpose of Looker is to democratize data across organizations. It transforms how companies use their data by providing a unified view that’s accessible, reliable, and actionable – moving beyond simple dashboards to create a truly data-driven culture.
Who is Looker Designed For?
Looker caters to a diverse range of users across organizations:
Data Analysts and Engineers: These professionals appreciate Looker’s robust modeling capabilities, which allow them to create reusable data models that maintain consistency while reducing repetitive work.
Business Users: Employees without technical backgrounds can easily explore data through intuitive interfaces, create visualizations, and generate reports without writing SQL code.
Executives and Decision Makers: Leadership teams benefit from accessible dashboards that provide real-time insights into key performance indicators and business metrics.
Developers: Technical teams can leverage Looker’s API and embedding capabilities to integrate data visualizations directly into internal tools or customer-facing products.
Looker has found particular success in sectors like eCommerce, tech, finance, and healthcare – industries with complex data needs that benefit from flexible analytics solutions.
Getting Started with Looker: How to Use It
Getting up and running with Looker involves several key steps:
-
Implementation: Typically begins with connecting Looker to your existing databases or data warehouses. Looker supports numerous database dialects including Google BigQuery, Amazon Redshift, Snowflake, and many others.
-
Data Modeling: Your data team will use LookML to create models that define relationships and calculations, essentially creating a semantic layer that translates complex data structures into business-friendly terms.
-
Exploration: Once models are set up, users can begin exploring data through Looker’s interface, using point-and-click functionality to filter, pivot, and visualize information.
-
Dashboard Creation: Users can build and share dashboards that provide real-time views of important metrics, with options to schedule regular updates or alerts.
-
Integration: For more advanced implementations, Looker can be embedded into existing applications or workflows using the Looker API.
While Looker offers extensive documentation and training resources, most organizations partner with Looker’s implementation specialists or certified consultants to ensure proper setup – particularly for the critical data modeling phase.
Looker’s Key Features and Benefits
Core Functionalities of Looker
Looker distinguishes itself through several standout features:
LookML Data Modeling: The heart of Looker’s architecture, LookML allows data teams to define dimensions, measures, calculations, and relationships in a centralized, version-controlled environment. This creates a semantic layer that translates complex database structures into business-friendly terminology.
Embedded Analytics: Looker’s architecture supports embedding dashboards and visualizations into other applications, enabling organizations to integrate analytics directly into existing workflows or customer-facing products.
Data Actions: Move beyond passive analysis with built-in capabilities to trigger actions based on data insights – such as creating tasks, sending notifications, or updating records in other systems.
Data Delivery: Schedule and automate delivery of reports and insights via email, Slack, or other channels, ensuring stakeholders receive timely information without needing to log in.
Cross-Database Joins: Connect and analyze data across multiple databases or data warehouses, creating a unified view without complex data migration.
Git Integration: Version control for your data models ensures changes are tracked and can be collaborated on, similar to software development workflows.
Looker Blocks: Pre-built analytical patterns and data models that accelerate implementation for common use cases and data sources.
Advantages of Using Looker
Looker offers several compelling benefits compared to traditional BI solutions:
Centralized Data Governance: The LookML modeling layer ensures consistent definitions and calculations across the organization, eliminating the “many versions of the truth” problem that plagues many analytics efforts.
Reduced Analytics Bottlenecks: By providing self-service capabilities to business users while maintaining central governance, Looker reduces the burden on data teams and accelerates time-to-insight.
Real-Time Analysis: Unlike tools that rely on pre-aggregated data or overnight processing, Looker generates queries on-demand, providing up-to-the-minute insights based on current data.
Scalability: Looker’s architecture separates computation from visualization, leveraging your database’s processing power rather than moving data into a proprietary system, enabling it to scale with your data volume.
Flexibility: From casual business users to technical analysts, Looker adapts to different technical skill levels and use cases within the same platform.
Cloud-Native Design: Built for modern cloud data architectures, Looker integrates seamlessly with cloud data warehouses like BigQuery, Snowflake, and Redshift.
Main Use Cases and Applications
Organizations deploy Looker across numerous scenarios:
Business Performance Monitoring: Creating real-time dashboards for tracking KPIs across departments like sales, marketing, finance, and operations.
Customer Analytics: Understanding user behavior, engagement patterns, and conversion funnels to optimize products and marketing strategies.
Embedded Analytics: Integrating data visualizations into SaaS products, customer portals, or internal applications to provide contextual insights.
Data Applications: Building custom, data-driven applications that combine analytics with workflow capabilities.
Financial Planning: Analyzing budget variances, forecasting scenarios, and monitoring financial health metrics.
Supply Chain Optimization: Tracking inventory levels, supplier performance, and logistical efficiencies to reduce costs and improve operations.
Healthcare Analytics: Monitoring patient outcomes, operational efficiencies, and compliance metrics in healthcare settings.
Exploring Looker’s Platform and Interface
User Interface and User Experience
Looker’s interface balances power with accessibility, catering to users with varying levels of data literacy:
Explore Interface: The primary workspace for data analysis features an intuitive, point-and-click environment where users can select dimensions and measures, apply filters, and visualize results without writing SQL code.
Dashboard Experience: Customizable dashboards combine multiple visualizations and filters, providing interactive views of key metrics that can be tailored for different audiences.
Development Environment: For data modelers and power users, Looker provides a code editor for working directly with LookML, including syntax highlighting, error checking, and project management tools.
Data Dictionary: An automatically generated catalog of all defined metrics and dimensions helps users understand what data is available and how it’s calculated.
The interface emphasizes clarity and consistency, with thoughtful touches like color-coding, tooltips, and contextual help that make the learning curve more manageable for new users.
Platform Accessibility
Looker takes a comprehensive approach to platform accessibility:
Browser-Based: As a cloud-native application, Looker is accessible through any modern web browser without requiring local software installation.
Mobile Responsiveness: Dashboards adapt to different screen sizes, with a dedicated mobile app available for on-the-go access.
Integration Options: Beyond the core platform, Looker offers several ways to access data:
- Scheduled data delivery via email, Slack, or other channels
- Embedded visualizations in other applications
- Direct API access for custom integrations
- Looker-powered data applications
Accessibility Compliance: Looker maintains compliance with accessibility standards to ensure usability for individuals with disabilities, including keyboard navigation, screen reader compatibility, and color contrast considerations.
Language Support: The interface is available in multiple languages, supporting global organizations with diverse user bases.
Looker Pricing and Plans
Subscription Options
Looker follows an enterprise pricing model, with specific pricing tailored to each organization’s needs based on several factors:
| Plan Type | Typical Users | Key Differentiators |
|---|---|---|
| Core Platform | Mid-sized to enterprise organizations | Full modeling capabilities, embedded analytics |
| Looker for Google Cloud | Google Cloud customers | Deeper integration with Google Cloud, simplified billing |
| Looker Studio Pro | Organizations needing lighter analytics capabilities | More accessible entry point, self-service focus |
Each deployment is priced based on a combination of factors including:
- Number of user licenses required
- Database connections needed
- Implementation complexity
- Support level requirements
- Specific features required
Free vs. Paid Features
While Looker is primarily an enterprise platform without a true free tier, Google offers several entry points:
Free Options:
- Looker Studio (formerly Google Data Studio): A free version with basic reporting capabilities, though lacking the full data modeling power of Looker
- Trial Period: Enterprise customers can typically access a proof-of-concept period before committing to a full implementation
- Demo Environment: Prospective customers can explore a sample Looker instance with pre-built dashboards
Paid Features that differentiate enterprise Looker include:
- Full LookML modeling layer
- Advanced user management and role-based access controls
- Git integration for version control
- White-label embedding capabilities
- Advanced scheduling and data actions
- Enterprise support and SLAs
- Custom development environments
Organizations typically engage directly with Looker’s sales team for a custom quote based on their specific requirements and use cases.
Looker Reviews and User Feedback
Pros and Cons of Looker
Based on aggregated feedback from users across multiple review platforms, here’s how Looker’s strengths and limitations stack up:
Pros:
- Powerful Data Modeling: LookML provides unmatched flexibility and consistency in defining metrics
- Self-Service Analytics: Enables non-technical users to explore data independently
- Embedding Capabilities: Superior options for integrating analytics into other applications
- Git Integration: Version control for data models is relatively unique among BI tools
- Modern Interface: Clean, intuitive design that balances power with accessibility
- Google Cloud Integration: Seamless connectivity with Google Cloud Platform services
Cons:
- Learning Curve: LookML requires investment to master, especially for organizations new to data modeling
- Implementation Time: The initial setup period can be longer than with some plug-and-play alternatives
- Cost: Enterprise pricing may be prohibitive for smaller organizations
- Mobile Experience: While improving, some users find the mobile experience less robust than desktop
- Visualization Limitations: While covering most common scenarios, some specialized visualization types may require custom development
User Testimonials and Opinions
From verified user reviews across platforms like G2, Capterra, and TrustRadius:
“Looker transformed how our entire organization thinks about data. Before, we had siloed reports with conflicting numbers. Now everyone works from the same definitions, and business users can self-serve without constantly requesting reports from our analytics team.” – Director of Analytics at a SaaS company
“The learning curve for LookML is significant, but the payoff is enormous. We’ve eliminated countless hours of redundant report-building and drastically improved consistency. Our implementation took about three months, but has saved years of cumulative analyst time since then.” – Data Engineer at an eCommerce business
“Looker’s embedding capabilities allowed us to bring sophisticated analytics directly into our product, creating a competitive advantage. Our customers love having actionable insights without leaving our platform.” – Product Manager at a FinTech company
“The cost was initially difficult to justify to leadership, but after six months, the ROI became clear as we identified several operational inefficiencies that were costing us hundreds of thousands annually.” – VP of Operations at a healthcare provider
Most reviews emphasize that while Looker requires significant initial investment in both cost and implementation time, organizations that commit to proper setup generally see substantial long-term value.
Looker Company and Background Information
About the Company Behind Looker
Looker was founded in 2012 by Lloyd Tabb, Ben Porterfield, and Marc Randolph (who was also a co-founder of Netflix). The company emerged from Tabb’s experiences as a data analyst and his vision to create a more flexible, web-based approach to business intelligence.
Key milestones in Looker’s history include:
2012: Founded in Santa Cruz, California
2013: Raised Series A funding ($2 million)
2015: Expanded internationally, opening offices in New York and London
2017: Reached over 1,600 customers and introduced Looker Blocks
2019: Acquired by Google for $2.6 billion
2020: Integrated into Google Cloud’s data analytics portfolio
2022: Expanded embedding capabilities and introduced Looker (Google Cloud core) and Looker Studio brands
Since its acquisition by Google, Looker has maintained its core platform while benefiting from tighter integration with Google Cloud’s data ecosystem, particularly BigQuery. The company continues to operate somewhat independently within Google Cloud’s organization.
Looker’s leadership team includes:
- Gerrit Kazmaier: VP & GM of Data Analytics at Google Cloud, overseeing Looker
- Pedro Arellano: Director of Product Management
- Frank Bien: Former CEO who transitioned to an advisory role post-acquisition
The company maintains offices in several locations including Santa Cruz, San Francisco, New York, and London, with a growing global workforce that benefits from Google’s resources and reach.
Looker Alternatives and Competitors
Top Looker Alternatives in the Market
The business intelligence and analytics market offers several alternatives to Looker, each with distinct approaches and strengths:
Tableau: Long considered the industry standard for data visualization, Tableau excels in creating rich, interactive dashboards with a lower technical barrier to entry than Looker.
Power BI: Microsoft’s analytics platform offers deep integration with the Microsoft ecosystem and is often more cost-effective for organizations already invested in Microsoft products.
Domo: Combines strong visualization capabilities with robust data integration features and a business-user-friendly interface.
ThoughtSpot: Emphasizes natural language search and AI-driven analytics, making it particularly accessible for non-technical users.
Sisense: Offers powerful data processing capabilities, especially for handling large, complex datasets from multiple sources.
Qlik Sense: Features a unique associative engine that shows relationships between data points that might be missed in other tools.
Metabase: An open-source alternative that provides basic BI functionality at a lower cost point, popular with startups and smaller organizations.
Looker vs. Competitors: A Comparative Analysis
Here’s how Looker stacks up against its main competitors across key dimensions:
| Feature | Looker | Tableau | Power BI | Domo |
|---|---|---|---|---|
| Pricing Model | Enterprise, custom | Subscription, role-based | Per user + Premium | Enterprise, custom |
| Implementation Time | Longer (weeks/months) | Medium | Quick | Medium |
| Technical Expertise Required | Higher (for setup) | Medium | Lower | Medium |
| Data Modeling Approach | LookML (code-based) | Visual | Power Query + DAX | ETL-focused |
| Self-Service Analytics | ⭐⭐⭐⭐ | ⭐⭐⭐⭐⭐ | ⭐⭐⭐⭐ | ⭐⭐⭐⭐ |
| Embedded Analytics | ⭐⭐⭐⭐⭐ | ⭐⭐⭐ | ⭐⭐⭐⭐ | ⭐⭐⭐ |
| Visualization Flexibility | ⭐⭐⭐⭐ | ⭐⭐⭐⭐⭐ | ⭐⭐⭐⭐ | ⭐⭐⭐⭐ |
| Cloud Integration | ⭐⭐⭐⭐⭐ (Google) | ⭐⭐⭐⭐ (Salesforce) | ⭐⭐⭐⭐⭐ (Microsoft) | ⭐⭐⭐⭐ |
| Governance & Security | ⭐⭐⭐⭐⭐ | ⭐⭐⭐⭐ | ⭐⭐⭐⭐ | ⭐⭐⭐⭐ |
When Looker Shines:
- Organizations needing centralized data definitions and governance
- Companies wanting to embed analytics into their products
- Businesses with strong technical teams that value version control and git-based workflows
- Google Cloud customers seeking tight integration with that ecosystem
When Alternatives Might Be Better:
- Organizations with limited technical resources might prefer Tableau or Power BI
- Companies deeply invested in Microsoft might find Power BI more cost-effective
- Smaller businesses with basic needs might start with Metabase or Looker Studio (free)
- Organizations seeking AI-driven insights might prefer ThoughtSpot
Looker Website Traffic and Analytics
Website Visit Over Time
According to public web analytics data, Looker.com has shown consistent traffic growth since its acquisition by Google, with some seasonal fluctuations:
- Monthly Visitors: Approximately 500,000-700,000 unique visitors per month
- Annual Growth: ~15-20% year-over-year increase in traffic
- Peak Periods: Traffic typically spikes during major product announcements and the Google Cloud Next events
Geographical Distribution of Users
Looker’s global audience breaks down approximately as follows:
- United States: 42%
- India: 8%
- United Kingdom: 7%
- Canada: 5%
- Germany: 4%
- Australia: 3%
- France: 3%
- Japan: 2%
- Other countries: 26%
This distribution aligns with Looker’s enterprise focus and strong presence in markets with high cloud adoption rates.
Main Traffic Sources
The primary channels driving visitors to Looker.com include:
- Organic Search: 55% (dominated by product-related and educational queries)
- Direct Traffic: 20% (indicating strong brand recognition)
- Referral Traffic: 15% (primarily from Google Cloud and partner websites)
- Social Media: 5% (LinkedIn being the strongest channel)
- Paid Search/Display: 5% (targeted campaigns for enterprise decision-makers)
The high percentage of organic traffic suggests Looker has established strong authority in the business intelligence space, with users actively searching for the platform by name or related capabilities.
Frequently Asked Questions about Looker (FAQs)
General Questions about Looker
Q: What is Looker primarily used for?
A: Looker is primarily used for business intelligence, data analytics, and creating data-driven applications. It helps organizations transform raw data into actionable insights through visualizations, dashboards, and embedded analytics.
Q: Is Looker part of Google?
A: Yes, Looker was acquired by Google in 2019 for $2.6 billion and is now part of the Google Cloud platform. However, it maintains support for a wide range of databases beyond Google’s own offerings.
Q: Does Looker work with my existing database?
A: Looker supports most major SQL databases and data warehouses, including BigQuery, Snowflake, Redshift, PostgreSQL, MySQL, SQL Server, Oracle, and many others. It connects directly to these databases rather than importing the data.
Feature Specific Questions
Q: What is LookML and why is it important?
A: LookML is Looker’s data modeling language that allows you to define dimensions, measures, calculations, and relationships between data. It’s important because it creates a semantic layer that ensures consistent definitions across the organization and enables self-service analytics.
Q: Can Looker be embedded in my application or website?
A: Yes, Looker offers robust embedding capabilities that allow you to integrate dashboards, visualizations, or even the full exploration experience into your applications, with options for both iFrame embedding and more sophisticated API-based integration.
Q: Does Looker support real-time data analysis?
A: Yes, unlike tools that rely on pre-aggregated or periodically refreshed data, Looker generates SQL queries directly against your database when users explore data, providing real-time insights based on the most current information.
Pricing and Subscription FAQs
Q: How much does Looker cost?
A: Looker follows an enterprise pricing model with custom quotes based on factors like user count, database connections, and specific features needed. While pricing isn’t publicly disclosed, enterprise implementations typically start in the tens of thousands of dollars annually.
Q: Is there a free version of Looker?
A: There isn’t a free version of the full Looker platform, but Google offers Looker Studio (formerly Google Data Studio) as a free alternative with more limited capabilities. Enterprise customers can typically access a trial period before committing.
Q: What factors affect Looker pricing?
A: Key factors include the number of user licenses, number and types of database connections, level of support required, implementation services needed, and whether you need specific advanced features like embedding capabilities.
Support and Help FAQs
Q: What support options are available for Looker?
A: Looker offers several support tiers, typically including standard support (business hours), premium support (extended hours), and enterprise support (24/7 with dedicated resources). The specific options vary based on your contract.
Q: How long does Looker implementation typically take?
A: Implementation timeframes vary widely based on complexity, but organizations should typically plan for:
- Basic implementation: 4-6 weeks
- Moderate complexity: 2-3 months
- Enterprise-wide deployment: 3-6+ months
Q: Is training available for Looker users?
A: Yes, Looker offers various training options including documentation, video tutorials, guided courses, certification programs, and professional services. Many organizations also work with Looker-certified implementation partners for training.
Conclusion: Is Looker Worth It?
Summary of Looker’s Strengths and Weaknesses
After thoroughly examining Looker’s capabilities, it’s clear that the platform offers distinctive advantages while also presenting certain limitations:
Key Strengths:
- The LookML data modeling layer creates unparalleled consistency and governance
- Powerful embedding capabilities for integrating analytics into applications
- Git-based version control for data models enhances collaboration and tracking
- Strong integration with Google Cloud Platform
- Real-time query generation provides up-to-the-minute insights
- Flexible self-service exploration for business users
Notable Limitations:
- Higher cost entry point compared to some alternatives
- Steeper learning curve, particularly for the initial implementation
- Requires technical resources for optimal setup and maintenance
- Less suitable for small organizations with basic reporting needs
- Mobile experience, while improving, isn’t as robust as the desktop version
Final Recommendation and Verdict
Looker represents a substantial investment in both cost and implementation effort, but delivers corresponding value for organizations that fully leverage its capabilities. The platform is worth serious consideration for:
Organizations that should consider Looker:
- Mid-size to enterprise companies with complex data needs
- Businesses struggling with inconsistent metrics and “multiple versions of the truth”
- Companies wanting to embed analytics into their products or applications
- Organizations with technical resources who value software development best practices
- Businesses using Google Cloud Platform who can benefit from the tight integration
Organizations that might look elsewhere:
- Small businesses with limited technical resources or basic reporting needs
- Organizations seeking a quick, plug-and-play solution with minimal setup
- Companies with very tight budget constraints
- Teams looking primarily for ad-hoc analysis rather than established metrics
Ultimately, Looker excels as a comprehensive data platform rather than just a visualization tool. Its value proposition centers on creating a consistent, governed approach to analytics that scales across the entire organization.
For companies willing to invest in proper implementation, Looker can transform how data is used throughout the business – moving beyond isolated reports to create a truly data-driven culture where insights are accessible, reliable, and actionable.
The question isn’t simply whether Looker is a good tool (it certainly is), but whether your organization is ready to embrace the paradigm shift it represents – from disconnected analytics to a unified data platform approach.